


Model plots
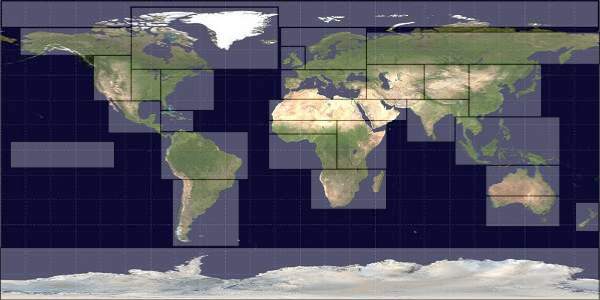
The map below is supplementary material for the climateeducation.net online courses.
It demonstrates the results of an ensemble modelling experiment by presenting the results from an experiment that was released by the climateprediction.net project at Oxford University in 2006. A global atmosphere-ocean climate model developed by the Met Office, called HadCM3L, was made available for download and running on personal computers anywhere. Climateprediction.net made available many different versions of the model, which took account of some of the various different plausible values used in the approximation of various processes in the climate system. Many thousands of generous volunteers around the globe donated their spare computing power to compute the model runs and return the results to climateprediction.net, from where the results are freely available for investigation.
Click on any region to see a summary of how a few thousand different model versions behaved in making projections of temperature and precipitation change up to the year 2080.
The temperature and precipitation change information you see here is the difference between a ‘transient’ model experiment and a ‘control’. In the transient experiment, when the model ran into the future it was supplied with a scenario of how greenhouse gas emissions would change, in particular the so-called ‘SRES A1B’ emissions scenario was used (see section 6.3 for more details). It was also supplied with a scenario of future changes in sulphur emissions (also SRES A1B), from which the future sulphate aerosol forcing was computed. In the control run no such changing future scenario was used for these two quantities. Estimates of future changes in solar output and volcanic activity were also included in the transient runs, but not in the controls, where the forcing was held constant. An ensemble of 4611 model runs was used to provide the results shown here. Each ensemble member represents the difference between a matched pair of transient and control runs, i.e. a model version that is the same in every respect except for the transient and control input forcings.
You can learn more about the model set-up by visiting climateprediction.net.
Earth image based on original by NASA (sensor Terra/MODIS), modified by Mdf, via Wikimedia Commons
Model results provided by Dan Rowlands and climateprediction.net.